If at first you don’t succeed

…copy somebody’s code. Or at least your own from the past that works.

I finally got the map to work for my Exhibit exhibit. See.


First I copied the tutorial here. When that was working, I carefully copied it to the file I wanted it to be in and… nothing. Still broken.

So next I commented out all extraneous stuff, and finally got it to work. Now came the fun part of tracking down what code was making my awesome map look like nothing. I narrowed it down to something within the <header> tag. So line by line I uncommented and tested until I tracked the issue down to the bootstrap.css file I was using.

Then came the same process within the bootstrap.css file. It was easily 1000 lines long, so a line by line process wasn’t going to work. Instead I commented out the first have of the file. Bing, the map displayed, so it was somewhere within that first 500 lines. Then I commented out the first 250 lines. Bing again. I kept dividing the culprits in half until I narrowed it down to styles for the img tag. Commented those out and I was in business.

Through that grueling process I lost the images of the documents on the first page. Now I have to figure out how to get those back, apply some styling and we’re all set.

Unfortunately I wasn’t ever able to get it to pull in the data from a spreadsheet, so the JSON file will have to do. The process for making a JSON file from a spreadsheet is simple:

1. Make the spreadsheet file so that the headers are encapsulated with curly braces ‘{ }’

2. If you’re using Google spreadsheets, export it as an Excel file. You’ll have to open it in Excel and save it as an older file format, because the next step doesn’t like .xlsx.

3. Next, use Similie’s Babel tool to convert the spreadsheet to JSON.

4. Select “Excel” as the “from format” and “Exhibit JSON” as the “to format” and then browse to find the xls file you just made.

5. Click the “Upload and Convert” button.

6. The next screen is all of your spreadsheet data output into a nice JSON format.

7. Now you can use this JSON file for any number of things. But it’s especially nice to use it in an Exhibit to display your data.

This is cross posted at the class blog http://www.fredgibbs.net/clio3workspace/blog/if-at-first-you-dont-succeed/

Poster Session at the History of Ed

At the beginning of the year I was asked to participate in a poster session for the History of Education Society’s Annual Meeting. I have done a few things with maps, so I was asked to share resources and ideas for using maps with teaching history.

Not too many people came by, so I only spoke with two people. I had this list of resources for working with and teaching with maps:

History and Maps

Selected Websites

http://chnm.gmu.edu/worldhistorysources/unpacking/mapsmain.html (CHNM’s site on using maps in the classroom)
http://echo.gmu.edu/search/node/map (A list of map resources on the web, collected by GMU’s Echo project)
http://memory.loc.gov/ammem/gmdhtml/ (Library of Congress Map Collections)
http://www.besthistorysites.net/Maps.shtml (A long list of map related websites for teaching history)
http://explorethemed.com/Default.asp (Historical Atlas of the Mediterranean)
http://www.lib.utexas.edu/maps/ (Tons of maps sponsored by University of Texas at Austin)
http://www.flu.gov/whereyoulive/healthmap/ (US Gov. Flu Map)
http://www.unc.edu/awmc/index.html (Ancient World Mapping Center)
http://strangemaps.wordpress.com/ (Hundreds of posts about strange maps. Very good discussion starters.)

Selected Bibliography

Brown, Lloyd Arnold. The Story of Maps. New York: Dover Publications, 1979.
Bruckner, Martin. The Geographic Revolution in Early America: Maps, Literacy, and National Identity. Chapel Hill: Published for the Omohundro Institute of Early American History and Culture by University of North Carolina Press, 2006.
Field Museum of Natural History, and Newberry Library. Maps: Finding Our Place in the World. Chicago: University of Chicago Press, 2007.
Knowles, Anne Kelly, and Amy Hillier. Placing History: How Maps, Spatial Data, and GIS Are Changing Historical Scholarship. Pap/Cdr. ESRI Press, 2008.
Pickles, John. A History of Spaces: Cartographic Reason, Mapping, and the Geo-Coded World. London: Routledge, 2004.
Turnbull, David, and Deakin University. Maps Are Territories: Science Is an Atlas: A Portfolio of Exhibits. University of Chicago Press ed. Chicago: University of Chicago Press, 1993.
Virga, Vincent, and Library of Congress. Cartographia: Mapping Civilizations. Little, Brown and Company, 2007.

And this Keynote playing on my laptop:

40th anniversary of the moon landing

What space junky, almost historian, geek would I be without posting a little bit about some of the best type of history in existence. I refer, of course, to the history of man’s endeavors to explore space. On July 20, 1969, Neil Armstrong and Buzz Aldrin became the first humans to step on a celestial body other than Earth. Michael Collins waited in the Command capsule as the two American astronauts made human history.

So here are a number of resources and articles describing some cool things about space flight.

Apollo missions posterHistoric Spacecraft is an archive of space vehicles and other things space related. They have a lot of photos of vehicles, suits, and such. They also have posters and such for sell, if you’re inclined to have something on your wall. They also have stats and dates for all of the rockets and vehicles listed. A great source for photos for all your space history needs. Also really cool is a list of all completed Space Shuttle missions. Space Shuttle Discovery has flown the most missions, 36, so far (June 2009) with a total of 126 missions. The Space Shuttle Enterprise never made it to space, but you can see it at the Udvar-Hazy National Air and Space Museum in Dulles, VA. I’ve been there a couple of times, and it is extremely awesome.

Apollo 11 interactive guideNext up from Flightglobal is an interactive timeline of sorts, with lots of information about the missions, flights, computers, physics and people who made it possible to put man on the moon. Most amazing about the whole flight, is that everything was based on theory. There was no way to test the actual theoretical physics without flying to the moon and back. “Although the theoretical physics of travelling to the Moon had been laid down before the advent of the Apollo missions, this was the first time a series of manned missions had put the theory into practice.”

apollo 11 softwareSpeaking of computers, Linux.com has a neat write up about the software used to guide the Apollo 11 spacecraft to the moon and back. It’s incredible to think that they were able to do such an amazing thing with technology comparable to today’s calculators. All of the code used punch cards and took hours to see if it was written properly. Jerry Bostick described the process in the Linux.com article:

“We would give instructions to the programs by punching cards,” Bostick said. “You had to wait at least 12 hours to see if it would work right.” The early programming was done in the real-time computing complex in Houston using IBM 7094 computers with 64K of memory. There were no hard disks. All the data was stored on magnetic tape, with each computer having about eight tape drives. Most programs used for the mission were written in Fortran, Bostick said. “After Apollo 1, we upgraded to the biggest and the best equipment that government money could buy, the IBM 360 with an unheard of 1MB of memory. We went all the way from 64K to 1MB.”

lunar lander gamesMoving from space computers to space computer games, the Technologizer has a great piece about a well loved space game, Lunar Lander. This game started out as a text-based game written by a high school student. It became popular and was later turned into countless graphical spin offs. I’m playing one on the iPod Touch a bit too much at the moment. You can see I made the top 20 players for a while!

19th place

museum moonFinally, New Scientist has a number of interesting articles relating to the 40th anniversary of the moon landing. One article addresses with the ethics and issues with the moon being a historic spot. Wherever there is a piece of human debris or footstep, it’s historically valuable. Should all of these sites and artifacts and footprints be protected? What happens when/if tourists are able to visit the moon? Who’s going to be the museum curator and the tourist guides? I’ll take that job!

Another New Scientist article lists several reasons why the moon is still relevant to science, for government, commercial enterprise and the normal guy.

interactive moon mapLastly, New Scientist has a neat interactive map showing the many multi-national places on the moon where humans have left their mark and made exploration.

WTTGG #3

I almost forgot for this week, but found some stuff today, so here goes….

And a small disclaimer, or explanation first. Instead of just making this a list of cool stuff out there, I’m going to try to tie it into the field of history or academia. That will get me to think a bit more and hopefully stay true to my desires to have this blog about history and new media.

So… First off we have a couple of gadgets, of the software kind:

paintbrush
Gadget #1: Paintbrush. [Mac only] Have you ever wanted to just make a quick drawing or picture in Mac. It’s not that easy without Paintbrush. It gives Mac users a semblance of Microsoft Paint. Now, what’s the application to history, et al.? Ummm… I don’t know either. I’ll get a strike for this one…

skitch
Gadget #2: Skitch.com This is a new service that allows you to quickly take an image and annotate, draw, and share. You can grab photos from your iPhoto library, take screen shots, or import images. When you’re done drawing and such, you can upload it to your own account on skitch.com and share your photos. Check out my test photo at http://skitch.com/mossiso/ This might come in handy as another way for historians to share photos and their ideas. A teacher could upload some images and draw specific things… yeah, it’s a stretch too.

Tip #1: US National Archives Research Online and the US Holocaust Memorial Museum. OK, OK, here’s a real tip for the historians. I’ve been looking for some information on the “Quarz” project started by the Nazis in late 1944. There is supposedly some photos at the National Archives, but I haven’t found them yet. I was tipped off to this topic by a friend and co-PhD student at GMU who works at USHMM. She knew of some nice had drawn maps that relate to project Quarz. So I took some digital copies of these maps, and want to use them in a project this semester. The above linked resources help in searching for documents, images, etc.

Well, the tips, tricks, gadgets and goodies were a bit lacking this week. Enjoy what you can of it.

Graphical representations of genealogy

I have this thought, and it was brought to mind again by an article on Wired which linked to this artists (Jason Salavon) work with the US census data. Basically, he took the US census data over 200 years and created an image with a ribbon of color representing each county.

My idea is similar, kind of. While thinking about projects to do for my history and maps class this semester, and while talking with a colleague, I wondered how one could graphically represent ones genealogy. Most of us in the United States have ancestors that came from somewhere else. Many of us have ancestors that came from multiple somewhere elses. Looking at my ancestry alone I claim Arizona, Colorado, Utah, England, Sweeden, Germany and I’m sure several other places I don’t yet know of. One thought as to how to do this would be with a world map and lines and dots representing locations and familial connections. The lines and dots would be in gradients of color, each color representing a date. I tried doing a mock up in Photoshop quickly, but it wasn’t working right. I’ll have to do it in Flash, since that behaves like I expect. Flash might be a better platform anyways, because the map is then dynamic and can be dragged, zoomed, and dots and lines can be given data associated with them.

The MA is done, but the map is not….

I just turned in my last thing for the MA! I’m a Master! I do the commencement and walking and stuff tomorrow night.

Well, I showed the Yahoo Map and the Flash movie to the 1989 group. They really liked it, but as is always the case, there are some very good suggestions for improvement. And since I have a vested interest in the project (my academic research interests are all about this topic), and since I’m pretty much the only one at work who can do this stuff, I will be continuing the project until it’s completion.

Some suggestions and modifications are:

  • Move the text out of the Flash and into the html. This makes it available to search engines and styling.
  • Have the timeline only be for 1989, and put tick marks, or some other designator for months on the bar.
  • Change the fading of countries. Russia, Latvia, Estonia, Lithuania, and Yugoslavia should not fade out.
  • Change Soviet Union to Russia, and outline or shade the Yugoslavia and Soviet Union groups to show they are a group.
  • Take out the events for China.
  • For the yahoo Map: recenter the map on marker click, and take out the word wrapping.

So here’s the latest version of the Flash movie. 1989events

Making progress

I took out the audio from the intro because it just wasn’t working. Perhaps a voice recording about the fall of communism would be better.

I worked on the timeline a lot the past couple of days. It took many, many attempts to finally get the dot that represents an event to look nice. Fifteenth times a charm, they say! I also have the events coming in by year, month, and day. There’s probably an easy way to do that with actionscript, but I couldn’t think of it. So instead I have a layer for the years, divided into the three years (1987-1989). Then another layer for the months. Each of the three years gets it’s own set of months. Then a third layer for days (1-31, depending on how many days in the month). The days layer only has frames for November and March of 1989, when most of the events happened. So, on each section of frames I wrote a variable like theYear, theMonth, and theDay in the actionscript. This variable is then checked for in the main actionscript, and matched against the events day, month, year before it is allowed to be displayed.

It works pretty well, except for the 1989 events for December. The all show up at the same time. So, now I have to fix that, and add another 40+ coordinates to the xml file by deciding where it is located, finding the x, y coords, then typing it into the xml file.

Anyhow, here’s the latest and greatest Intro_Timeline

How does the yahoo/flash map work…

There’s a lot of tutorials out there, but here’s how I got it to work.

The Plan

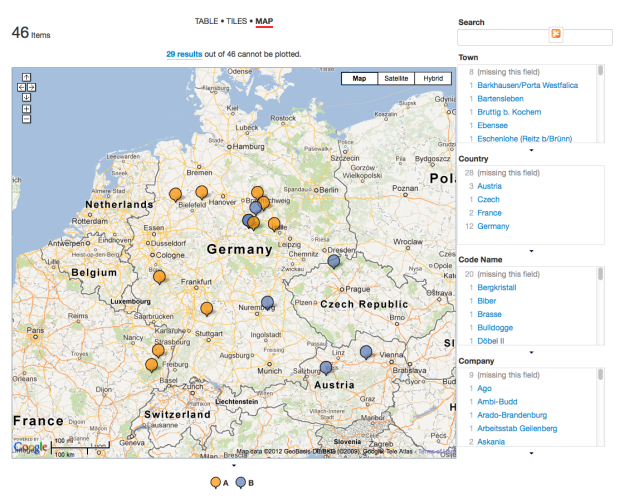
Got what? Oh, well, basically it’s being able to use yahoo maps, flash, xml, php, mysql, and data to display a bunch of markers on a map. Each marker contains data pulled from the database, and has a link to a page that displays the full information. For now, I just made a display page. But sometime latter, it will be implemented into the fine Omeka install that the 1989 project will use.

The Steps

Here’s an outline of what I did.

  1. Create a flash file using the yahoo flash map api component. Available at Yahoo.
  2. Add some ActionScript to the first frame that will import data from an xml file.
  3. Create a php page that pulls in data from a MySQL database and displays as an xml file.

Create the swf

In order to make Yahoo and flash play nicely, you need to install the component linked above. Follow directions there. This will add a new component to your Flash program, available in your components window (Window->Components->Yahoo->com.yahoo.maps.api.flash.YahooMap).

Once that’s installed, create a new empty fla. Make a keframe in the first frame on layer one. Drag the yahooMap component onto your stage.

Next, add another layer for your actionscript.

the ActionScript

Here’s the tricky part. Here’s the code I used, heavily commented:

[code lang=”Actionscript”]
/*********************************
* File: yahoomap.as
* Author: Ammon Shepherd
* based off of many tutorials and code snippets, mostly from Yahoo! documentation.
********************************/
//Set the URL where the xml file is.
var xmlURL = “http://chnm.gmu.edu/1989/maps/xml.php”;

//Import Yahoo map tools
import com.yahoo.maps.LatLon;
import com.yahoo.maps.markers.CustomPOIMarker;
import com.yahoo.maps.tools.PanTool;
import com.yahoo.maps.widgets.*;

//Create a listener associated with the instance of the Yahoo map component.
// Set the map to pull down the yahoo map and get the setting/changes from
// the onMap function.
euroMap.addEventListener(com.yahoo.maps.api.flash.YahooMap.EVENT_INITIALIZE, onMap);

//This will add a zoom tool and set it as closed by default
var zoomer:NavigatorWidget = new NavigatorWidget(“closed”);

//The onMap function adds the tools, settings, and markers to the map.
function onMap(eventData) {
//create a new PanTool and name it pantool
var pantool:PanTool = new PanTool();

//tell the instance of the map to use the new PanTool called pantool
euroMap.addTool(pantool, true);

//Add the Navigator widget
euroMap.addWidget(zoomer);

//Create a variable called xmlData of the type XML
var locations_xml:XML = new XML();

//igore white space
locations_xml.ignoreWhite = true;

//when the xml file is loaded, do the fuction within
locations_xml.onLoad = function(success){
//if the xml file loaded successfully run the function addMarkers
if (success) addMarkers(this);
};

//then actually load the xml file.
locations_xml.load(xmlURL);

/*******************************************
* Used this for testing, you don’t really need it. I was thinking of using
* this in the future to display the lat and long to the user.
//Get the center of the map and store them in the variable called points.
var points = euroMap.getCenter();
//trace(“before convert” + points);
//swap the points, so long->long and lat->lat
convert(points);
//trace(points);
******************************************/

}

//This is the function that adds the markers to the map.
function addMarkers(xml:XML):Void {
//the addresses variable holds the path to the right xml element.
//firstChild is the and childNodes is an array of the tags
var addresses = xml.firstChild.childNodes;

for(var i=0; i then the second and so on for all of them.
address = addresses[i];

/***************************************************************
* MarkerData is the object that holds the info for each marker.
* index: is the text that shows up on the marker (usually just A or
* what have you. you could use the variable i to show an
* incremented number (each marker has it’s own number).
* title: sets the title of the marker and corresponds to the title
* parameter in the location tags in the xml file.
* description: is the larger text. It corresponds with the description
* parameter in the location tag in the xml field.
* markerColor: sets the color of the marker, duh 🙂 It’s the border
* color, and the color when not expanded.
* strokeColor: is the background.
***************************************************************/
var MarkerData:Object = {index: ‘\’89’, title:address.attributes.info, description:address.attributes.description, markerColor:0xcc0000, strokeColor:0xceccc7};

/****************************************************************
* This actually adds the address to the map using the custom point of
* interest style of marker (you can use your own style if you like.
* the address.attributes.loc grabs the latitude and longitude from
* the loc=”” part of the location tag in the xml file. MarkerData
* is the stuff we just set above.
****************************************************************/
euroMap.addMarkerByAddress(CustomPOIMarker, address.attributes.loc, MarkerData);
}
}
[/code]
Download yahoomap.as

(Special thanks to CodeSnippet for providing a way to show code. This was the 5th one I tried that finally worked.)

The PHP/XML

Next we need an xml file. I need to pull the data from a database, so I used a php script which pretends to be an xml file. The basics of that is to put this in the php file:
[code lang=”php”]
// Date in the past
header(“Expires: Mon, 26 Jul 1997 05:00:00 GMT”);
// always modified
header(“Last-Modified: ” . gmdate(“D, d M Y H:i:s”) . ” GMT”);
// HTTP/1.1
header(“Cache-Control: no-store, no-cache, must-revalidate”);
header(“Cache-Control: post-check=0, pre-check=0”, false);
// HTTP/1.0
header(“Pragma: no-cache”);
//XML Header
header(“content-type:text/xml”);
[/code]

Then, because our database doesn’t store the geocodes by default yet, nor do the items have any type of specific address or what not associated with them, I created an array with specific places and their lat, long. Each of the items in the database have tags associated with them. The array corresponds to tags that have countries names on them. This poses a problem if the tag name is changed, but for now it works OK.

[code lang=”php”]
$countries = array(
array(“Poland”, “52.1874047455997”, “19.072265625”),
array(“East Germany”, “52.517474393230245”, “13.41156005859375”),
array(“Czechoslovakia”, “49.210420445650286”, “17.490234375”),
array(“Hungary”, “47.45780853075031”, “19.05029296875”),
array(“romania”, “45.98169518512228”, “25.07080078125”),
array(“Yugoslavia”, “44.26093725039923”, “18.96240234375”),
array(“Bulgaria”, “42.601619944327965”, “25.24658203125”),
array(“Soviet Union”, “55.70235509327093”, “37.79296875”)
);
[/code]

The problem I ran into next was that there were over 15 markers that would share the same lat an long. This makes it hard to click on a marker when it’s buried under 20 other markers. So at first I tried just adding a couple of digits to the lat and long as it looped through the array. This led to a long line of markers, and didn’t look very good. Random numbers to the rescue! To create a clustering affect I generated two random numbers, one for the lat and one for the long. This number was added giving the markers a clustered appearance. Here’s that part of the code:

[code lang=”php”]
echo “< ?xml version='1.0' ?>

“;

for($g=0; $g‘;

}
}

echo ‘
‘;
[/code]

You may notice my call to the description function (which, in turn, calls a function called truncate, but you wouldn’t know that yet). This simply turns all HTML characters into their HTML entity characters. HTML in an XML file will break the XML file… more specifically the < and " ' characters. The truncate function I grabbed from php.net's comments for substr_replace. The truncate function shortens long text to a set number of words, and adds an ellipse at the end to signify more text. Here are those two functions:

[code lang=”php”]
function description($id,$text){
$description = wordwrap(htmlentities(truncate($text,200), ENT_QUOTES),30);

$fulltext = $description.”\n<a target=’_blank’ href=’http://chnm.gmu.edu/1989/maps/results.php?id=$id’>Show item</a>”;

return $fulltext;
}

function truncate($text,$numb) {
// source: www.kigoobe.com, please keep this if you are using the function
//$text = html_entity_decode($text, ENT_QUOTES);
if (strlen($text) > $numb) {
$text = substr($text, 0, $numb);
$text = substr($text,0,strrpos($text,” “));
$etc = ” …”;
$text = $text.$etc;
}
//$text = htmlentities($text, ENT_QUOTES);
return $text;
}
[/code]

Here’s the whole php file.
That basically does it.

xml, and lots of time.

Back again. Only two weeks left of school.

I spent the past two days trying to work XML into the picture for the time line aspect. The thought was, if all of the data for the ‘flash point’ or points of the events of 1989 were kept in an xml file, the the flash could dynamically add them in at the right place and time.  I can bring in the xml data, but I can’t get it to display the correct information for each event. It always shows the last events data. I have a for loop to grab all of the data from the xml file, then it attaches the ‘flash point’ movie clip in the correct place. Then I assign an onRollOver and onRollOut to that movie clip (dynamically named). But the onRollOver just holds the data from the last element in the xml instead of each attached movie clip holding the data for it’s respective event.

This would be really cool to do, because then to add or remove events from the timeline, just edit the xml file.  The xml filed could even theoretically pull the data in from the database, making so that each person can have their own specific timeline.  That would be way cool. But it unfortunately seems a bit beyond me. The other obstacle is about the time aspect. How can I get the flash point to show up at the right time. I’d have to come up with a bunch of mathematical voodo on where the timeline bar is (the _x position on the stage) and the percentage left and compare that with the date of the event somehow. Aargh! Way too confusing for my feeble brain.

I’ll just have to do the easy hard code the events into the timeline. Anyhow, here’s what I have so far on the intro/timeline (which, I’m realizing, I’ll need to have a front page where you select which one you want to view, or have them separate instead of one after the other). Version 0.0.2.3.9.5 (or something like that)